I build AI and data systems that turn messy evidence into decisions.
Applied AI engineer and data analyst. I work across production agents, anomaly detection, graph analysis, ranking systems and quantitative research, then build the interface that makes the result usable.
A language model will answer questions about a company's filings fluently and give no way to check the figures. In finance, a plausible wrong number costs more than no answer.
System
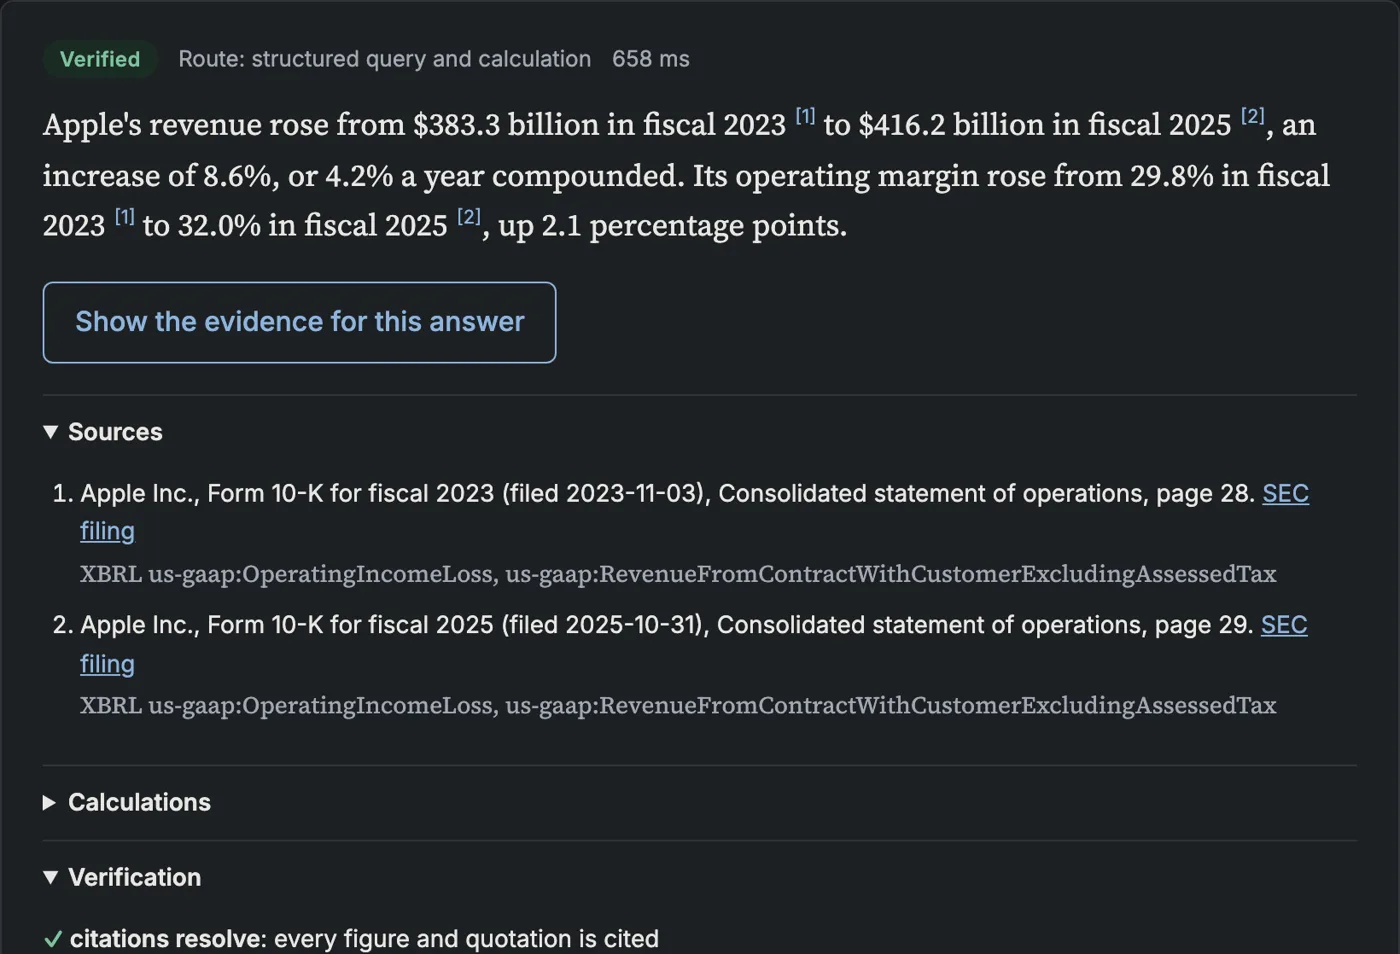
Routes each question to validated SQL over XBRL figures, hybrid search over 10-K text, or both. Every change is computed in code, every figure, calculation and quotation is re-verified before release, and questions the filings cannot support are refused.
What I built
The EDGAR ingestion and page-level lineage, the router and LangGraph pipeline, the verifier, a 72-question evaluation, and a browser build that runs the full Python pipeline on GitHub Pages with no server.
Why it matters
Every number arrives with the statement and page it came from, and the system says so when it does not know.
Architecture
SEC EDGAR
PostgreSQL + pgvector
Router
SQL / hybrid retrieval
Verifier
Cited answer
A verified answer, each figure cited to its statement and page
Evidence
Correct
98.6%
71 of 72 hand-written questions across eight categoriesmeasured
Refusals
100%
precision and recall on the 18 questions that should be declinedmeasured
Corpus
81 reports
10-K filings from 15 companies, 97.1% of figures traced to the printed pagemeasured
A merger that quietly dies leaves no announcement. The evidence is scattered across 8-K exhibits and proxy fields that disagree with each other.
System
Builds a deal dataset from SEC EDGAR, runs an 8-K rules engine over the filings, and reconciles proxy fields that contradict one another before anything is counted.
What I built
The EDGAR ingestion, the rules engine, the ambiguity resolution and the reconciliation logic.
Why it matters
A dataset you can audit deal by deal, rather than a number you have to trust.
An assistant that invents one figure is worse than no assistant, because nobody can tell which figure it was.
System
Computes every quantitative claim from a system of record and reconciles it against source evidence before release. Where a figure cannot be grounded, it abstains and names what was missing.
What I built
The retrieval stack, the evidence gate, the deterministic verifier and the adversarial test harness that attacks it.
Why it matters
Hallucinated figures become structurally impossible rather than merely unlikely.
Architecture
Question
Routing
Hybrid retrieval
Evidence gate
Deterministic verifier
Answer or abstain
Evidence
Attacks blocked
59 of 59
adversarial attempts to slip an ungrounded figure throughmeasured
Unsupported claims
0
across 146 evaluation questionsmeasured
Corpus
214 docs
24 funds, 12 metrics in the registrymeasured
Stack
Python
FastAPI
RAG
pytest
Role
Sole designer and engineer.
04 / Data incidents caught before dashboards drift
Risk reporting tends to produce a number without the chain of reasoning that would let anyone argue with it.
System
A 59-model warehouse over a simulated portfolio, with controls that catch bad trades before they reach a report, and VaR explained back to its inputs.
What I built
The warehouse models, the control suite and the reporting layer.
Why it matters
Every risk figure can be traced back to the trades that produced it.
Architecture
Trade and position data
59-model warehouse
Control suite
VaR and exposure
Report
Evidence
Models
59
warehouse models over a simulated portfoliomeasured
Errors caught
16 of 16
planted trade errors, zero false alarmsmeasured
Portfolio
EUR 755m
simulated, not a real booksynthetic
Stack
Tableau
SQL
Python
DuckDB
VaR
Role
Sole designer and engineer.
02
Capabilities
Each capability names the work that evidences it, rather than sitting in a tag cloud.
Capability mapped to the projects that demonstrate it
Capability
What it covers
Evidence
Production AI
Retrieval, routing and grounding for assistants that answer over documents, with verification in front of the answer.
Touchstone, QuantiFire IR assistant
Data engineering
Pipelines, warehouse modelling and the data-quality checks that stop bad rows reaching a report.
SignalOps, PipelinePulse, Stratum Analytics
ML evaluation
Golden sets, planted-truth holdouts, calibration and significance testing wired into CI.
SignalOps, Calibration-Optimised Equity
Quantitative analysis
Equity research, portfolio construction, VaR and execution modelling.
Calibration-Optimised Equity, Stratum Analytics
Frontend systems
Interfaces that make a model inspectable, including work that runs entirely in the browser.
Attention Lens, SignalOps
Technical communication
Architecture documents, decision records and written evidence a non-specialist can follow.
Touchstone dossier, 150+ investment notes
03
Project index
Every project migrated from the previous site, 79 of them, searchable and filterable. Nothing was dropped.
// or Ctrl K
79 projects
Live apps 20
W/01
FinBERT fine-tuned on 1.1M SEC filings. Tone vector per sentence, exponential decay aggregation at document level, hedge-language detection trained on management guidance revisions. Flags tone shifts ahead of analyst consensus updates.
Hybrid forecast ensemble. Social sentiment via FinBERT, Polymarket mid-price across seven contracts, LSTM-Transformer on 1-minute OHLCV with 60-second refresh. Signals reconciled through a Bayesian confidence layer.
82k EDGAR filings chunked, embedded with bge-small, indexed in pgvector. Semantic search with BM25 re-rank, grounded RAG with per-claim citation tooltips, anomaly detection on filing cadence via IsolationForest.
SVI parametric fit on listed option chains, neural residual network closes the mid-price gap. Three static arbitrage scanners - butterfly, calendar, vertical spread - enforce no-arbitrage constraints in real time. Rendered as a live WebGL surface.
GPT-2 small running locally via ONNX on WebGPU kernels. All 144 attention heads captured per forward pass, rendered as interactive heatmaps and token-to-token Bezier links.
Variational autoencoder on cross-sectional equity returns. Learns a low-rank latent representation that disentangles systematic style exposures from residual alpha. Orthogonality enforced via KL regularisation, factors ranked by monthly information coefficient.
Compute-optimal scaling experiments on a 120M-parameter GPT-2 derivative. Sweeps model size, token budget and learning rate to empirically re-derive the 20 tokens-per-parameter rule at a tractable scale. Full loss curves and isoFLOP contours rendered in-browser.
AI text likelihood reviewer. Thirteen detection signals adapted from GLTR, DetectGPT, Binoculars and Ghostbuster, combined into a confidence band rather than a fake precise percentage. Runs entirely in the browser, no text ever leaves the page.
SQL migration safety reviewer. Scores migrations for breaking-change risk, flags locking hazards and destructive statements in place, then rewrites them into a safer expand, migrate, contract plan. Client side only, no database credentials ever touched.
Cobertura coverage reader that turns a raw coverage.xml into a ranked test debt queue. Scores uncovered regions by complexity, churn and public API exposure, then emits heuristic descriptions of what the missing tests should actually cover.
Python code quality scorer. Upload a PDF of source, get a 0 to 100 grade with flagged anti-patterns, complexity hotspots and performance concerns highlighted inline. Static analysis in the browser, handy for reviewing candidate submissions.
A live dashboard demonstrating thirty plus AI-assisted design skills, applied to a fictional B2B SaaS. Every interaction shows a technique, not a prop.
Turns GitLab CI/CD and merge-request data into DORA metrics, flaky-test detection, pipeline slowdown alerts and CI cost, behind 44 data-quality checks that block publishing. On 436k seeded job runs it caught 14 of 14 injected slowdowns with no false alarms. Specified in Kiro.
An exact integer money engine lost 0 minor units over 1,000,000 seeded bill splits where floating point lost 767,538, and a virtualised feed renders 100,000 transactions in 39 ms with 344 DOM nodes. Merchant categorisation hits 97.9 percent against 71.9 percent for keywords, with 0 axe violations.
Investment reporting for a simulated €755m family office: a Tableau workbook with 4 dashboards and 59 calculated fields, plus a matching web dashboard. Its data checks caught all 16 planted trade errors among 9,373 trades with no false alarms, where a simple threshold rule raised 267.
Maps queues, effort and rework in a fictional insurance-claims process handling 5,200 claims a month, then builds a stress-tested business case: about 1,070 adjuster hours a month freed and a 5.4-month payback that halves if exceptions climb.
Scores three fictional AI-platform vendors on five weighted criteria under four stakeholder views, with a UK data-residency knockout that removes 1 of the 3 whatever it scores. The CFO weighting changes the recommendation.
Reproduced Nanda et al. 2023 in a 1 layer transformer trained on addition mod 113. Train saturates at step 400 but test only groks at step 10,900. Reverse engineered the Fourier circuit and showed six key frequencies preserve 94.5 percent test accuracy.
Benchmarks three execution strategies against live LOBSTER AAPL order book data: Almgren Chriss closed form, Obizhaeva Wang transient impact and a PPO agent trained on simulated book dynamics.
Tested whether better-calibrated classifiers pick better stocks across 457 S&P 500 names (2010 to 2024 data). Random Forest calibrated best (ECE 0.026) and its portfolio returned 68.1 percent over the 2021 to 2024 test, ahead of SPY at 66.1 percent, though with a lower Sharpe (0.77 vs 0.83).
ML enhanced factor investing combining Value, Momentum, Quality and Low Volatility with XGBoost regime timing. Backtested Sharpe ratio of 0.94 with dynamic allocation driven by macro indicators.
Ensemble gradient boosting model for consumer loan default. AUC ROC 0.89 with well calibrated probability estimates ready for expected loss and credit scoring.
Leak proof ML pipeline on 10,503 company year records with 64 financial ratios, 50 percent missingness and a 20 to 1 class imbalance. LightGBM hit AUPRC 0.6249 and AUC ROC 0.926.
Prices weather contracts on Polymarket and Kalshi. Ingests NOAA and ECMWF forecasts, converts to implied probabilities, scores mispricings and places risk sized orders. Ships with a validated research log separating backtest from live PnL.
Ingests live odds, computes fair probabilities from historical base rates, sizes stakes with fractional Kelly and logs expected value against realised PnL for every position.
Reproduced Gibbs and Candes on four regimes. Adaptive conformal stays within 0.3 points of the 90 percent target while split conformal under covers by 8 to 25 points.
From scratch FNO learning the one step solution map of the 1D viscous Burgers equation. Trained at N = 64 and evaluated zero shot at N = 256 plus out of distribution viscosities. Beats MLP and CNN baselines on relative L2 error and tracks ground truth energy decay within 0.35 percent.
Head to head comparison on one base model for financial sentiment classification. Matched compute budgets, reports macro F1 on a held out test set and measures throughput, peak GPU memory and adapter file size.
Benchmarks a Dense Autoencoder, an LSTM Autoencoder, Isolation Forest, Local Outlier Factor and statistical baselines on the same labelled stream. Evaluates detection lag, precision at low FPR and drift behaviour.
End to end churn pipeline on the IBM Telco dataset. Compares Logistic Regression, Random Forest and XGBoost with business oriented evaluation via cumulative lift, calibration analysis and decile level targeting. On 7,043 customers, targeting the riskiest 20 percent reaches 55 percent of churners, a 2.7x lift over random outreach.
Unsupervised topic modelling on 14,000 plus discussion posts. LDA found 17 topics with twice the coherence of NMF (0.65 vs 0.32). Adds urgency scoring, pain point extraction, extractive summarisation, severity clustering and topic category cross analysis.
UK residential price prediction across 10 major cities. R squared 0.88 with 28,500 pound MAE, analysing location premiums, energy performance impacts and transport accessibility against Land Registry data.
Ensemble ML for B2B SaaS churn hitting AUC ROC 0.91. Identifies at risk customers through engagement metrics, NPS analysis and behavioural patterns across the subscription lifecycle.
Six node LangGraph pipeline ingests live geopolitical events, runs multi hop supply chain traversal across 154 S&P 500 companies, and scores cascading risk in under 8 seconds. Built at the LangChain x SurrealDB London Hackathon.
Predicts fashion product trend scores from engagement signals and product attributes. XGBoost model hits R squared 0.78, enabling inventory optimisation and marketing allocation.
ML analysis of trend evolution from 2015 to 2024, examining silhouette shifts, sustainability adoption and social media influence on propagation. XGBoost at R squared 0.82 for lifecycle prediction.
Zero shot fashion object detection using OWL ViT and CLIP for pseudo label generation and knowledge distillation to YOLOv8. Reaches 88.7 percent of supervised performance with a 99 percent annotation cost reduction.
Hybrid visual collaborative recommender for fashion ecommerce that targets the cold start problem. Attention based fusion of ResNet visual features with neural collaborative filtering.
Enterprise system architecture for order to cash and procure to pay automation. Hierarchical data flow diagrams, structured narration tables, system flowcharts and integration specifications.
Strategic analysis of AI adoption frameworks and organisational transformation. Socio technical systems theory, adoption lifecycle modelling and HR strategy for technology driven change.
Comparative sustainability analysis of Rio Tinto and Lundin Mining using the GRI framework, Resource Based View theory and a Triple Bottom Line evaluation. Ships Python tools for ESG metrics.
Monte Carlo portfolio simulator over a 10-ticker TradingView watchlist. Geometric Brownian Motion engine calibrated on live drift and EWMA volatility, 100 to 10k paths across four horizons. Strategy signals fuse RSI, moving-average crossover and MC upside asymmetry, overlaid with per-ticker X sentiment.
Terminal-style Monte Carlo dashboard for US metro housing prices. Mortgage-rate scenarios, rent-vs-buy crossover, broker chatter sentiment. Live ticks across major MSAs, all client side.
Species-accumulation Monte Carlo for deep-sea biodiversity. Bathyal, abyssal and hadal richness curves, depth-pressure profiles, Chao1 and ACE estimators with full methodology.
Terminal-style Monte Carlo dashboard for Near-Earth Objects with orbital-uncertainty propagation. Torino and Palermo scale gauges, astronomy chatter sentiment.
Lindblad master-equation Monte Carlo for superconducting, trapped-ion and neutral-atom QPUs. Bloch sphere, T1/T2 decoherence, circuit depth budget with full methodology and references.
Terminal-style Monte Carlo for active volcanoes with VEI eruption probability simulations. VEI by thermal hazard heat-matrix and volcanology chatter sentiment.
Terminal-style Monte Carlo for personal health biomarkers. HRV, VO2max, sleep, recovery, intervention signals and coach-note sentiment in one dashboard.
Chirp-mass posterior Monte Carlo for LIGO, Virgo and KAGRA events. Q-transform spectrograms and 4D corner plots over chirp mass, q, spin and luminosity distance.
Emergency food distribution system for a 28 day lockdown. Exponential smoothing demand forecasting, vehicle routing optimisation with the Google Maps API and capacity modelling.
An interactive monograph on the CPython interpreter. Single-page, with six live figures and a literature review. From source text to a running frame, with every step explorable.
An interactive monograph on the quant-finance Python ecosystem. Single-page, with seven live figures and a literature review. Tools, libraries and tradeoffs walked through end to end.
An interactive monograph on retrieval-augmented generation. Single-page, with seven live figures and a literature review. From dense indices to rerankers, walked through with examples.
An interactive monograph on optimal transport. Single-page, with seven live figures and a literature review. Earth-mover, Sinkhorn and Wasserstein, all explorable.
An interactive monograph on the Kalman filter. Single-page, with five live figures and a literature review. State, observation, gain and innovation, all derived from first principles.
An interactive monograph on ray tracing. Single-page, with six live figures and a literature review. From a camera ray to BRDFs and importance sampling, every step shown.
An interactive monograph on lossy image compression. The discrete cosine transform, quantization and the JPEG pipeline, with five live figures and a literature review.
An interactive monograph on object detection in computer vision. Single-page, with seven live figures and a literature review. From anchors to NMS, all laid out side by side.
An interactive essay on how a synthesizer actually works. Five live demos built on the Web Audio API. Oscillator, envelope, filter, LFO and the full signal chain.
Three machine learning demos that run entirely in your browser. No server, no API key, nothing leaves your laptop. ONNX models loaded once, run locally, ready to poke.
An interactive essay on how a neural network learns. A real MLP trains live in your browser, with every weight and activation visible. No frameworks, just primitives.
An interactive essay on how a computer reads code. Build a tiny programming language end to end, live in your browser. Lex, parse, evaluate, with every step editable.
An interactive essay on random walks, drawdowns and why stop losses behave differently than most traders expect. Five live simulations on browser only.
Developed a prototype investor-relations assistant with 1,143 automated tests, routing questions across vector search, BM25, text-to-SQL and knowledge-graph traversal over roughly 950,000 records across 23 tables. Designed an 8-lens verification workflow that calculates quantitative claims as SQL aggregates, reconciles each value to source evidence and abstains when support is insufficient, reaching 96.5% accuracy on a 200-question evaluation set.
Sep 2025 to Sep 2026
MSc Business Analytics
University College London
Completed September 2026 with a 72% average, final classification pending. Machine Learning, NLP, Predictive Analytics and Operations Analytics.
Sep 2023 to May 2026
Data Analyst
APJ Kapital, London
Built PostgreSQL pipelines and Tableau dashboards across more than 100,000 market and portfolio records, giving weekly investment reviews a consistent view of P&L, sector allocation and factor exposure for 30+ equities. Automated a daily market digest in n8n, and produced more than 150 investment notes and buy, hold and sell recommendations.
May 2022 to Oct 2022
AI Investment Programming Intern
MDOTM, Milan
Delivered customer-segmentation and investment-modelling tools in Python and R, and built a repeatable price-and-fundamentals preparation pipeline for ML forecasting inside a 40-person team whose platform went on to win two international fintech awards.
Sep 2021 to Jul 2025
BSc Business Analytics, minor in Accounting and Finance
Lancaster University
Upper Second-Class Honours. Data Mining, Databases, Simulation and Decision Analysis.
05
Credentials and languages
17 certificates across 8 issuers, each verifiable at source.